Classification Results from Analysis of DID files
Laidler, 5 December 2000
Overview
Classification related data from all available (about 2600) DID files for GSC2.2 plates were analyzed for variance in performance as a function of galactic latitude, pixel size, laser/white light, and survey. Results indicate systematically different classification performance for 25 micron scans. This supports omission of these data from the classification voting scheme.
Pixel size
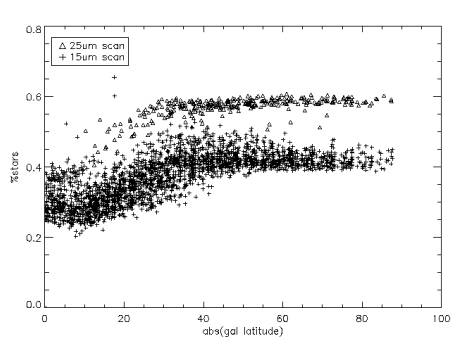
The plots essentially speak for themselves. Figure 1 shows the percentage of stars on the plate as a function of galactic latitude. There are clearly two populations: galactic structure is seen in the majority population (remembering that as we get closer to the plane, the percentage of stars goes down due to overlapped images from crowding), and a minority population with a higher percentage of stars “floats” above it. The populations clearly separate based on scan resolution.
(Recall that our scan archive contains 25 micron scans only for SERC-J plates (S plates) in the less crowded half of the southern sky.)
This is not a surprising result. Coarser scans contain less information with which to classify a given object. Also, the GSC2 classifier was trained and tuned exclusively with 15 micron data: it is unsurprising that the performance on 25 micron data would be systematically different.
Figure 1
Laser/white light
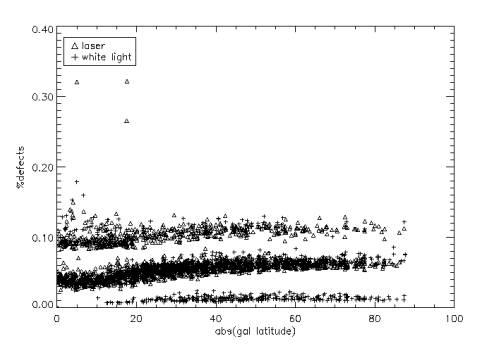
Figure 2 shows the percentage of defects plotted against galactic latitude. There do not seem to be systematic differences here or in the stars or nonstars plots as a function of illumination source. Although there is a distinct white light population in the plot, the other populations mix laser and white light, and this population can be explained by recalling that all 25 micron scans are white light scans.
This smaller population of 25 micron scans indicates that at coarser resolution, we do indeed detect fewer “false hits” as real objects.
The existence of a third population in this plot can, we believe, be explained by a change in the classifier. It appears that when we introduced the five tree voting, and the region averaging, the typical percentage of defects changed from ~5% to ~10%. (This was not noticed immediately; when it was noticed, no action was taken because there was no way to know which of these percentages was more correct than the other.) No third population appears in the percentages of stars or nonstars, so this is not a cause for much concern.
As expected, the percentage of defects is encouragingly flat as a function of galactic latitude.
Figure 2
Survey
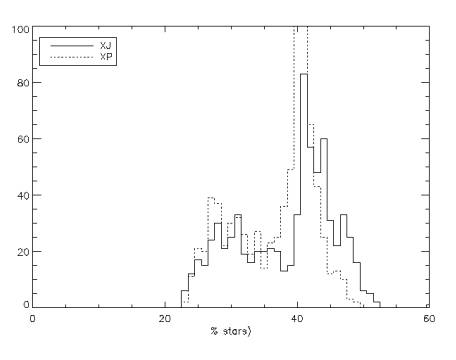
The comparison of the percentage of stars as a function of survey is interesting. Figure three shows the results for the northern surveys. There is a small difference in the location of the peak: this is consistent with a real difference in the color sensitivity of the surveys. The XP plates are more sensitive to faint red galaxies, thus decreasing the percentage of stars compared to the XJ plates. (For an explanation of the bimodal distribution, compare to figure one: this is a galactic latitude effect.)
Figure 3
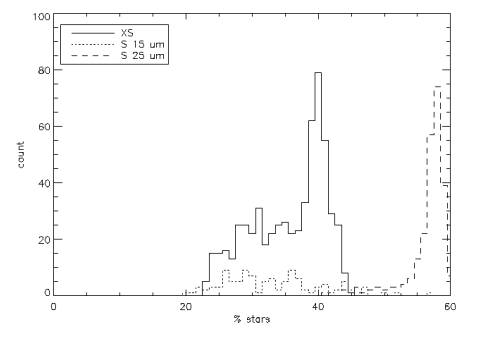
The comparison in the southern sky again shows evidence for the systematically different performance of the 25 micron scans. I find this plot to be the most compelling evidence that the classifications from the 25 micron data should be excluded when the final classification is computed.
Figure 4