Comparison of GSC2 Classifications to EIS Patch B
Laidler, 4 December 2000
Overview
7203 objects from the EIS Patch B catalog were compared to the XS411 OOP file. Results indicate less than 10% contamination of the GSC2 nonstar population, and less than 20% contamination of the GSC2 star population, in the magnitude range 15 < F < 19. Contamination of nonstars is relatively flat as a function of magnitude, and contamination of stars rises as magnitude decreases.
EIS Object Selection
EIS data is classified with the automatic classifier sextractor, which provides a stellarity probability for each object. The EIS Patch B data is a 1.6 square degree field available in three passbands, each of which is independently classified. A normalized sum-of-squares was adopted to combine the classifications from all three passbands. Analysis of the probability distributions (figure 1) indicated that there was a clear population near 0 (nonstars), a clear population near 1 (stars), and a clear population that was uncertain – most of which were faint. In order to provide an unambiguous comparison set, a lower limit of .85 in the combined stellarity index was selected for stars, and an upper limit of 0.10(?) was selected for nonstars. This produced a subset of 14527 objects, of which 7203 were matched. It is clear from the magnitude histogram (figure 2) that the unmatched objects were faint enough that they did not appear on our plate.
GSC2 Classifications
The EIS Patch B field occurs near the center of the XS411 plate (x=[7000:15000],y=[10700:13400]); thus the only matching plate is the 25um scan of the J plate, S411. With the voting scheme recommended for GSC2.2, the only effect of the S411 plate will be that the classification of matched defects will be overridden and replaced by nonstars. Since we know these are real objects, they will presumably be matched on the J plate. To simulate the effect of this voting, the comparisons in this report have been done with the defect classification replaced by nonstar classifications.
Completeness
Figure 3 shows the accuracy for the EIS stars and EIS galaxies as a function of magnitude, both in pure counts and percentages. These plots are essentially completeness results. We show at least 90% completeness in stars, and at least 85% completeness in galaxies, across the magnitude range 15 < F < 19.
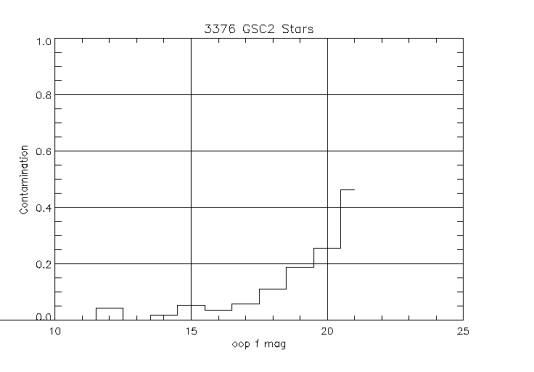
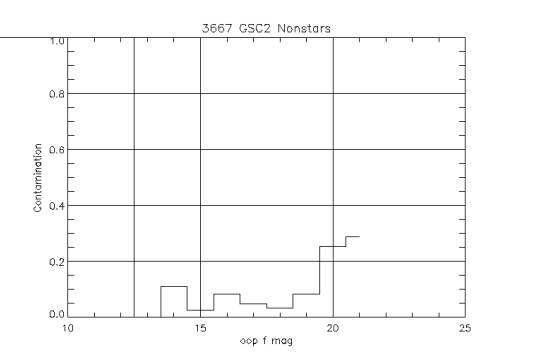
Contamination
Figure 4 shows the contamination results. To compute contamination, rather than considering the objects grouped by the EIS classification, we instead consider the objects grouped by the GSC2 classification. Here we show indicate less than 10% contamination of the GSC2 nonstar population, and less than 20% contamination of the GSC2 star population, in the magnitude range 15 < F < 19. The plots show contamination of nonstars is relatively flat as a function of magnitude, and contamination of stars rises as magnitude decreases.
Future work
The obvious next step is to match the J plate data, and verify the assumption made for this study. Catalogs for EIS Patches A and C have been requested, and a similar analysis will be done.
Figure 1 – Combined Stellarity Index
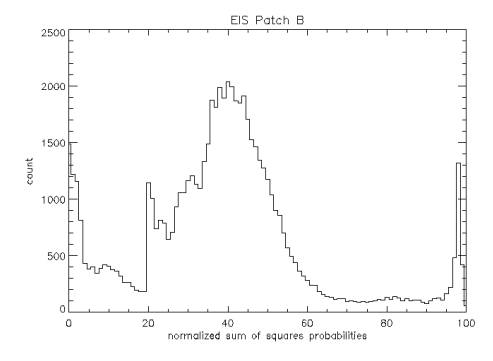
Figure 2 – Matching statistics
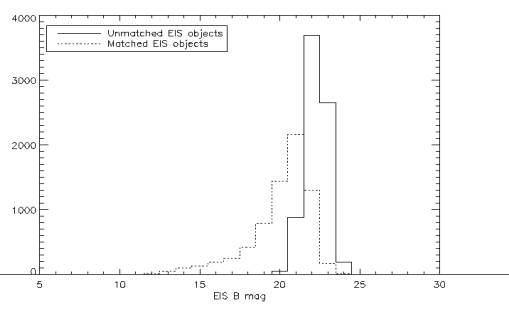
Figure 3 – Accuracy / Completeness
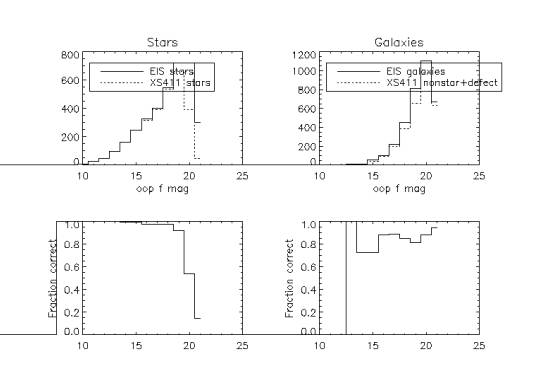
Figure 4 - Contamination