Further Classification Analysis of the GSC2.1.1/SPM/2MASS Matched Objects
Laidler, 8 January 2001
Overview:
Additional analysis of GSC2.1 classification compared to SPM and 2MASS is performed, broken down by magnitude and galactic latitude. Analysis of the 2MASS data shows that the contamination rate in the GSC2.1 stellar population varies dramatically with magnitude. Stellar contamination is less than 5% in the range 17<F<19, but approximately 40% in the 10<f<15 range. Contamination of the nonstellar population is more consistent , typically 20% in the range of 10<f<16.5.
Data:
The dataset compiled by Smart and discussed in his 30 November 2000 report was used for this analysis:
|
Catalog |
Matched GSC2.1.1 objects |
Approximate GSC2.1 mag range |
|
SPM stars |
257186 |
10<F<18 |
|
SPM galaxies |
31019 |
10<F<16 |
|
2MASS Point
Source Catalog (10h<RA<11h) |
1889592 |
10<F<19 |
|
2MASS Extended Source Catalog |
460825 |
10<F<17 |
All magnitudes in this report are quoted GSC2.1 magnitudes, for simplicity of comparison between stars and galaxies. These magnitudes are of course systematically incorrect for galaxies.
Analysis – SPM:
Figures 1 and 2 show the completeness and magnitude distribution of the SPM stars and galaxies, respectively, as a function of GSC2.1 F magnitude. There is some performance degradation for both stars and galaxies as magnitude decreases, which is contrary to our expectations in such a bright domain.
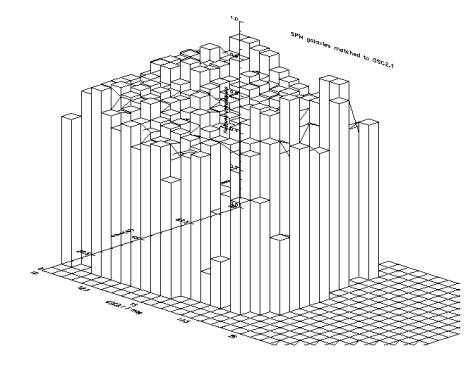
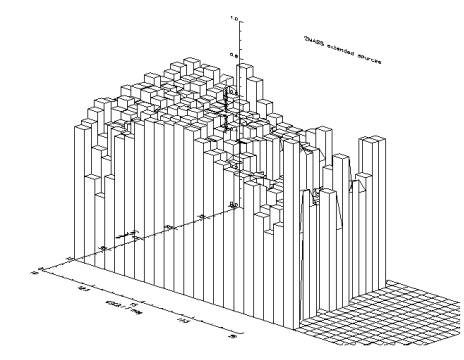
This may be dominated by galactic latitude effects. Figure 3 shows the coordinates of SPM stars that we classified wrongly. Figures 4 and 5 show fractional completeness for SPM stars in a 2d histogram binned by magnitude and abs(b). The data are identical in these two plots; only the perspective has been rotated.
Figures 5 and 6 show the same data for the SPM galaxies.
Figure 1
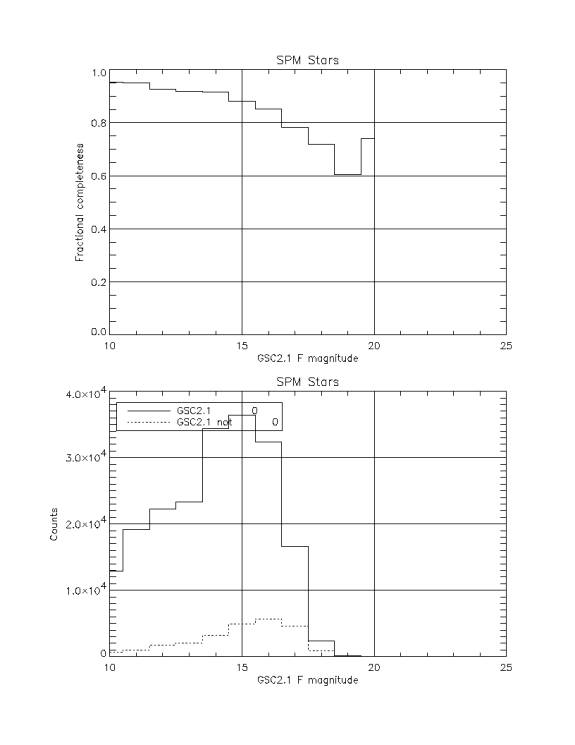
Figure 2
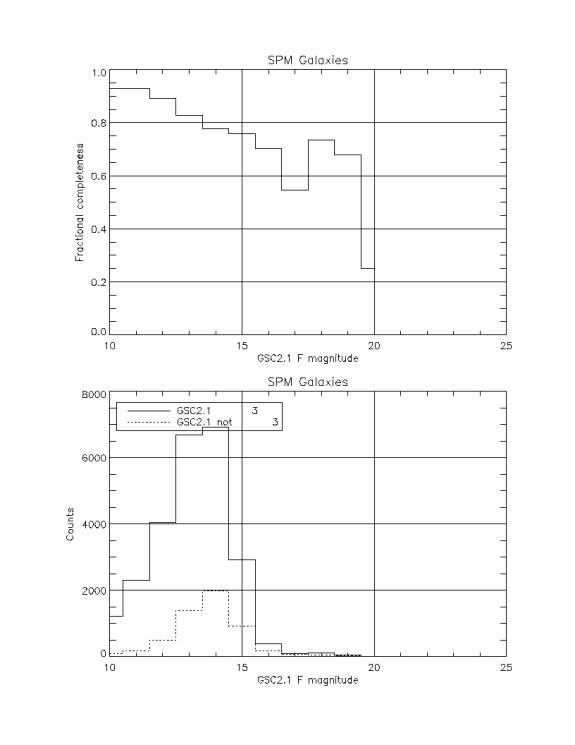
Figure 3
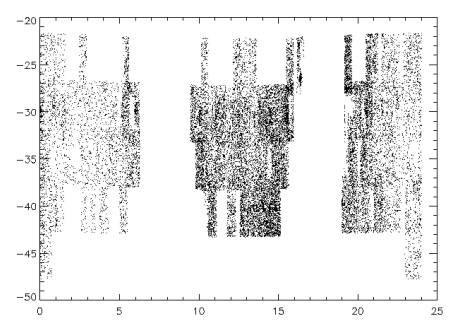
Figure 4
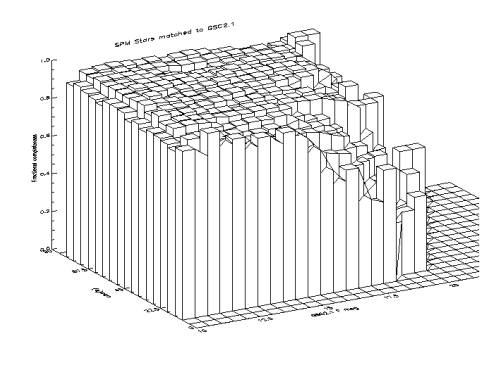
Figure 5
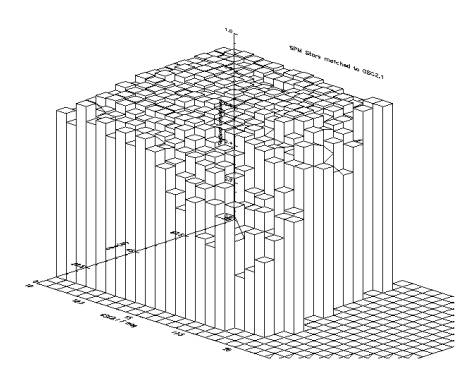
Figure 6
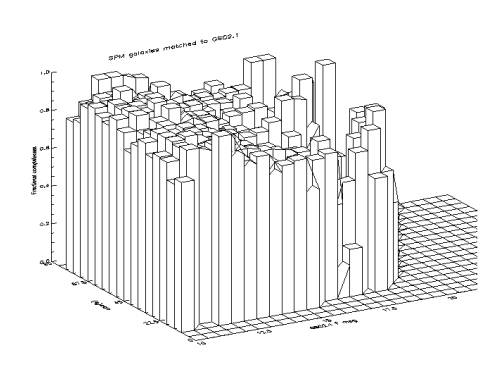
Figure 7
Analysis – 2MASS
Figures 8 and 9 show the completeness and magnitude distribution of the 2MASS stars and galaxies, respectively, as a function of GSC2.1 F magnitude. The performance is much flatter for both stars and galaxies than for the SPM. Perhaps this arises from larger number statistics. Certainly the drop in percentage completeness seems to coincide with the drop in population as a function of magnitude.
Figures 10 and 11 show the completeness data for the 2MASS extended sources in the same 2d histogram described above.
Figure 8
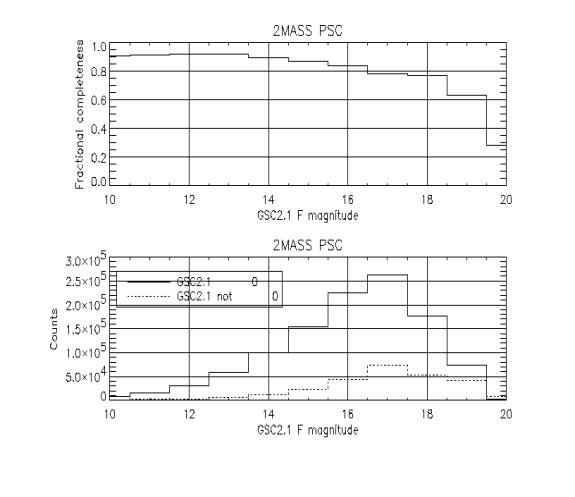
Figure 9 (ignore SPM in title)
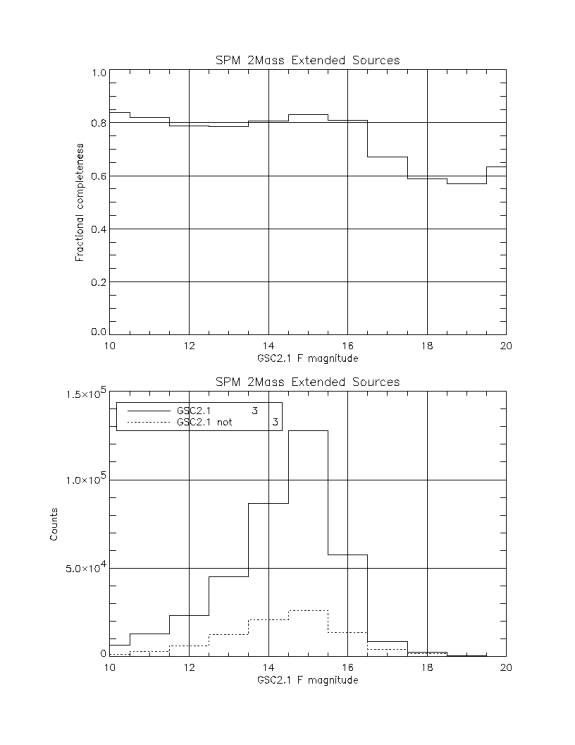
Figure 10
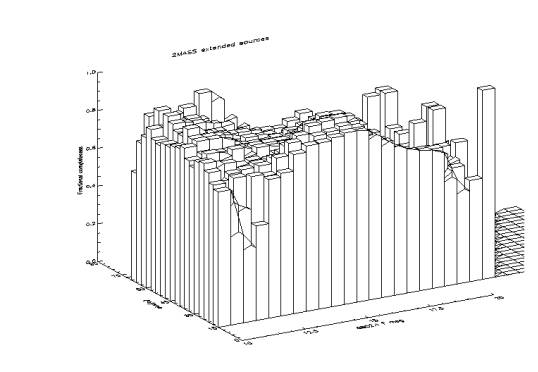
Figure 11
To estimate the contamination as a function of magnitude, I regrouped the data (as in the earlier report on the EIS patch B catalog) to consider accuracy rates for the GSC2.1 stars and GSC2.1 nonstars in this population. I selected only about a third of the PSC matched objects, to obtain a sample of numerical parity with the extended sources. Figure 12 shows the magnitude distribution of the resulting sample, while figure 13 shows the magnitude distribution when grouped as GSC2.1 stars and nonstars. Figures 14 and 15 show the contamination rate and magnitude distribution for GSC2.1 stars and nonstars.
Figure 12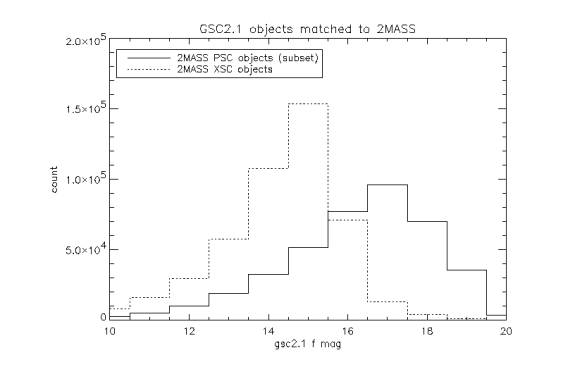
Figure 13
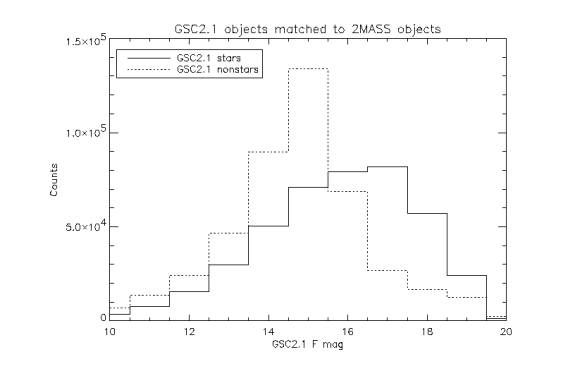
Figure 14
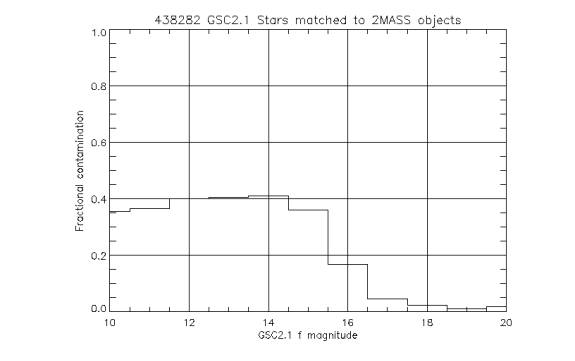
Figure15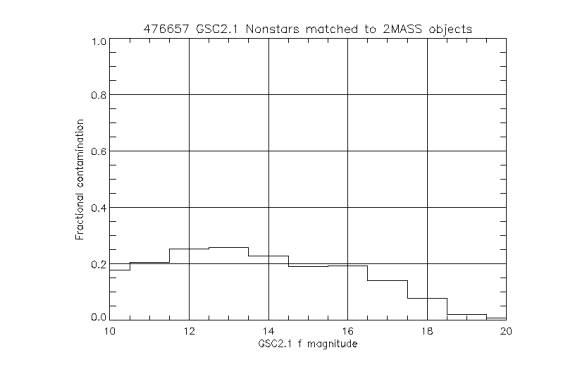
As expected, the contamination of GSC2.1 stars by 2MASS galaxies is high, especially at the bright end. The performance appears to improve dramatically beginning at about 16th magnitude. The contamination of GSC2.1 nonstars by 2MASS stars (or at least point sources – we presume they are stars but note Ricky’s caveat on this in his 30 Nov report) seems to be quite flat as a function of magnitude. It seems to again improve beginning at around 16th magnitude, but the population statistics start dropping off here so it’s difficult to be sure.
The interesting question is whether the classification voting scheme planned for GSC2.2 will improve these results. Unfortunately we do not yet have the software tools to do such an analysis on this data set, but we can spot check a few objects that we got wrong and see what the voting will do.